2280-表示一个折线图的最少线段数
给你一个二维整数数组 stockPrices ,其中 stockPrices[i] = [dayi, pricei] 表示股票在 dayi
的价格为 pricei 。 折线图
是一个二维平面上的若干个点组成的图,横坐标表示日期,纵坐标表示价格,折线图由相邻的点连接而成。比方说下图是一个例子:
请你返回要表示一个折线图所需要的 最少线段数 。
示例 1:
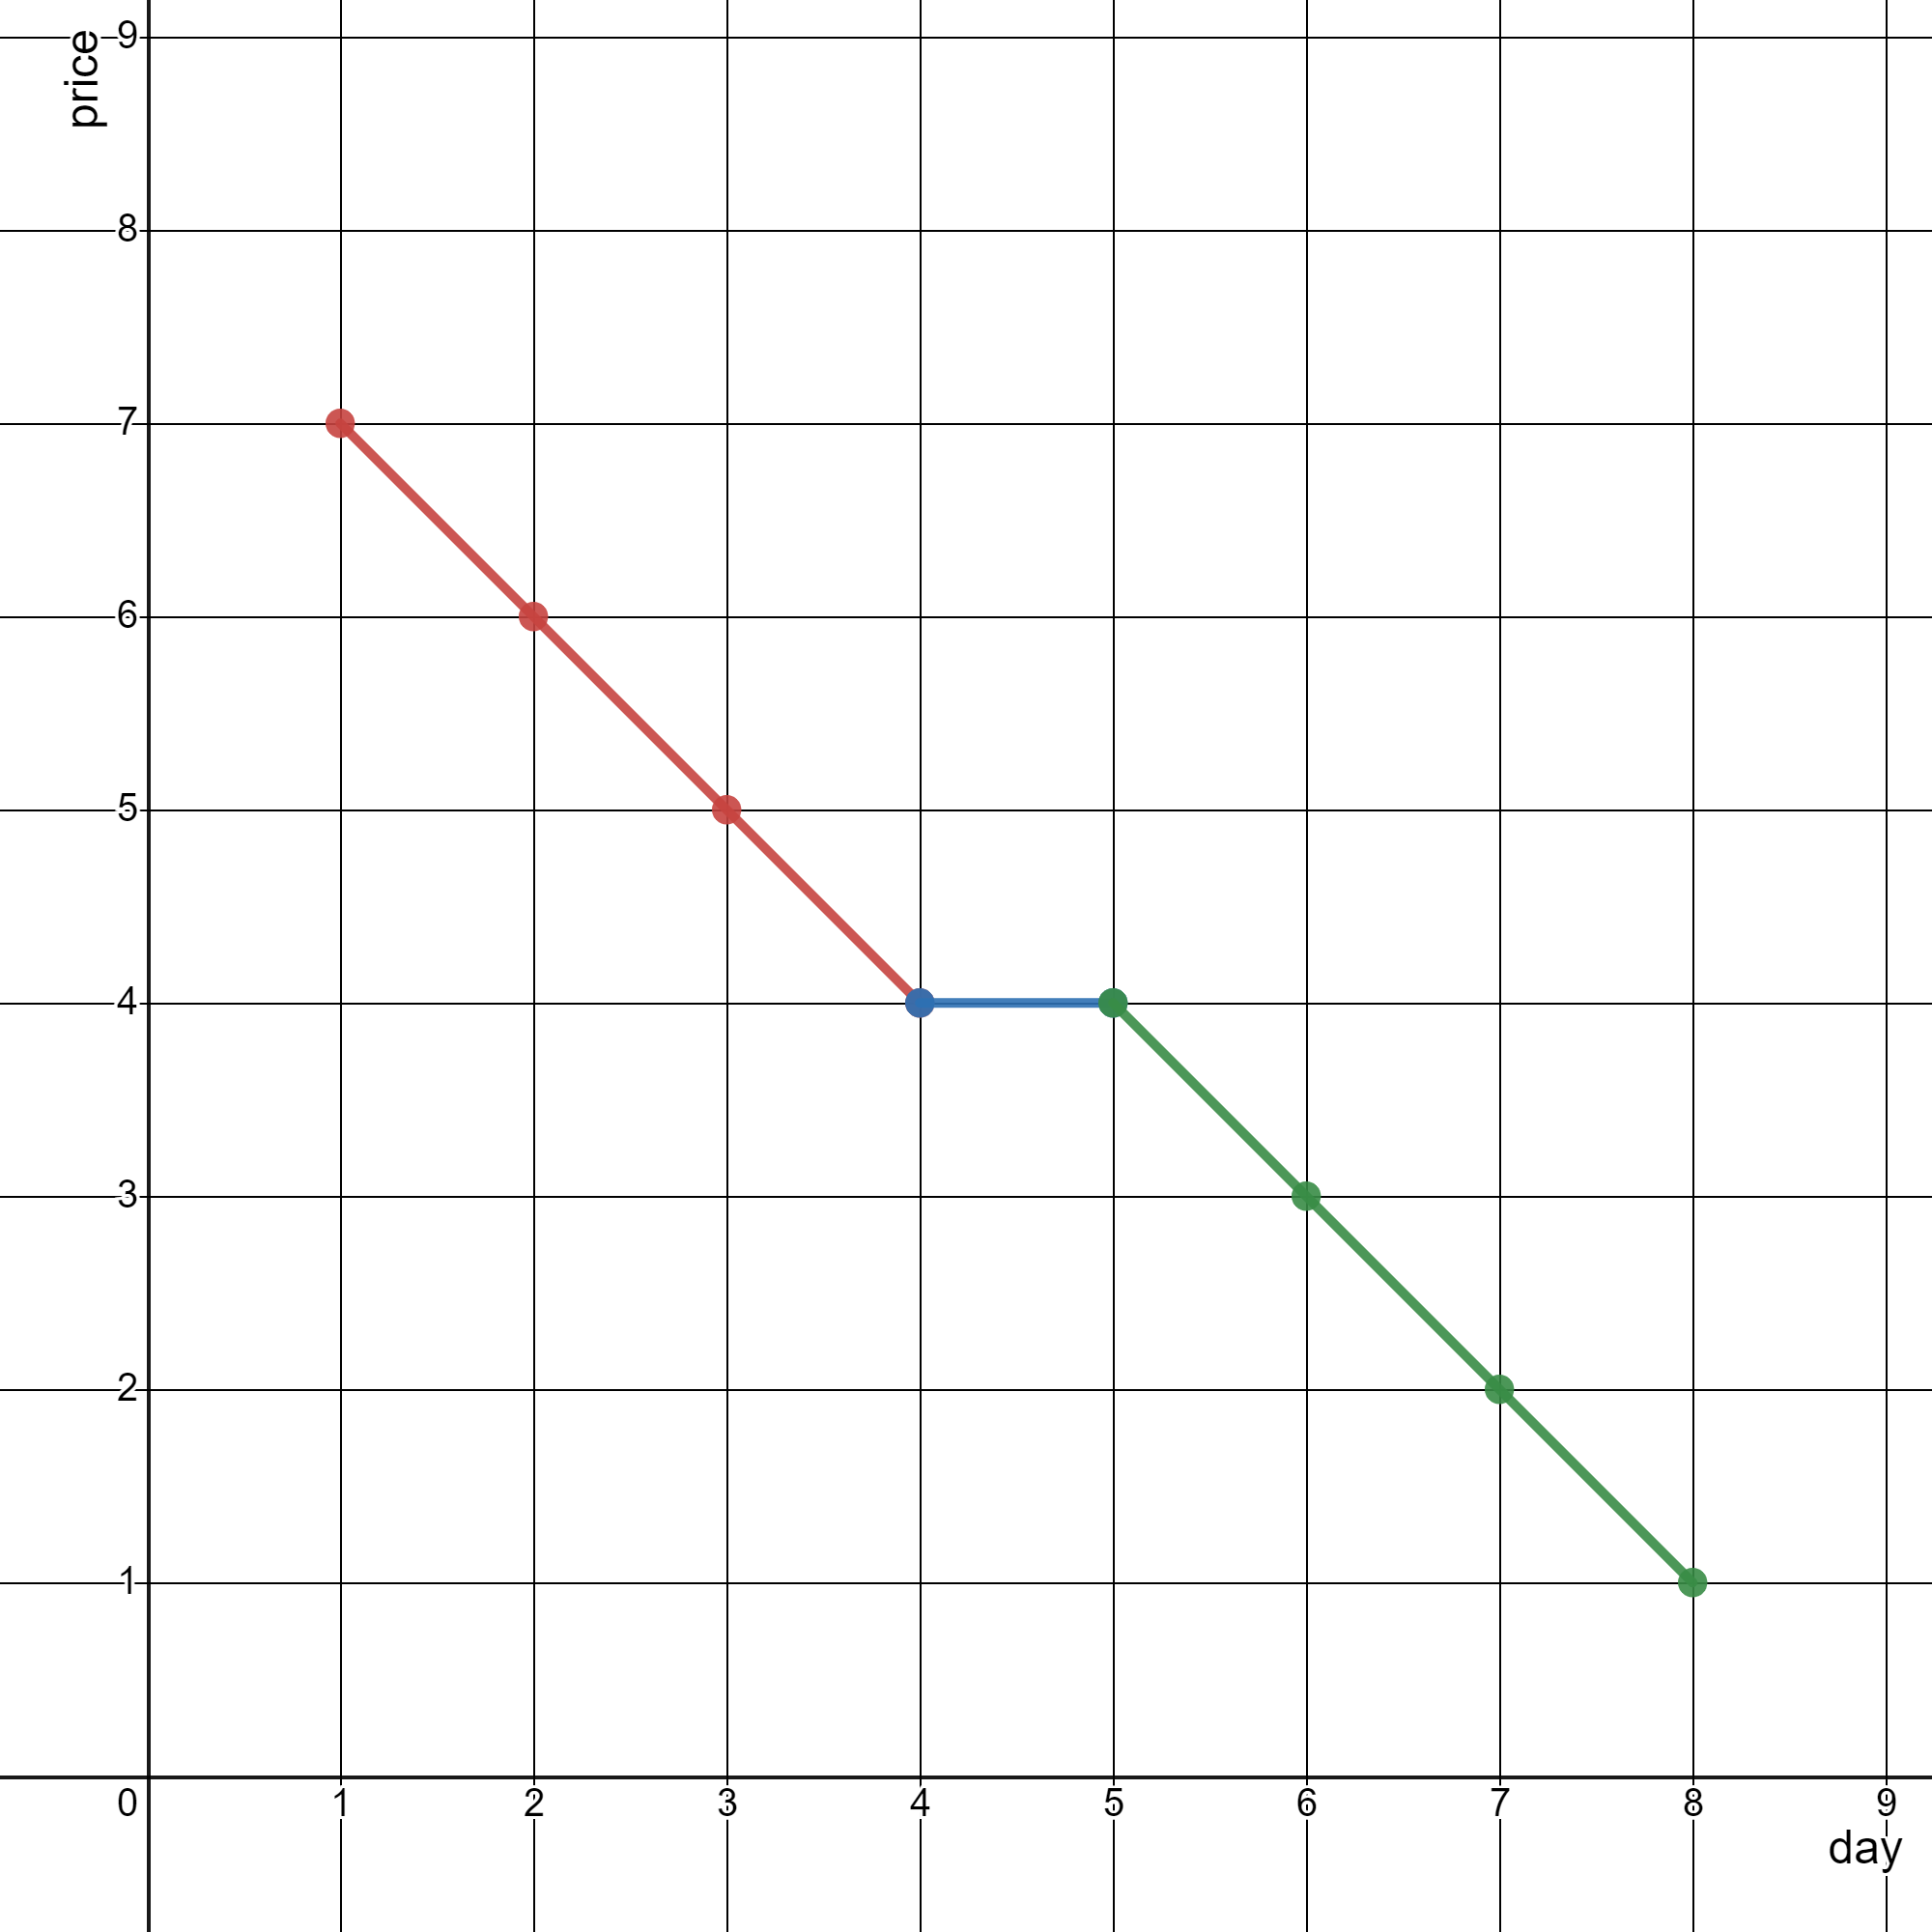
**输入:** stockPrices = [[1,7],[2,6],[3,5],[4,4],[5,4],[6,3],[7,2],[8,1]]
**输出:** 3
**解释:**
上图为输入对应的图,横坐标表示日期,纵坐标表示价格。
以下 3 个线段可以表示折线图:
- 线段 1 (红色)从 (1,7) 到 (4,4) ,经过 (1,7) ,(2,6) ,(3,5) 和 (4,4) 。
- 线段 2 (蓝色)从 (4,4) 到 (5,4) 。
- 线段 3 (绿色)从 (5,4) 到 (8,1) ,经过 (5,4) ,(6,3) ,(7,2) 和 (8,1) 。
可以证明,无法用少于 3 条线段表示这个折线图。
示例 2:
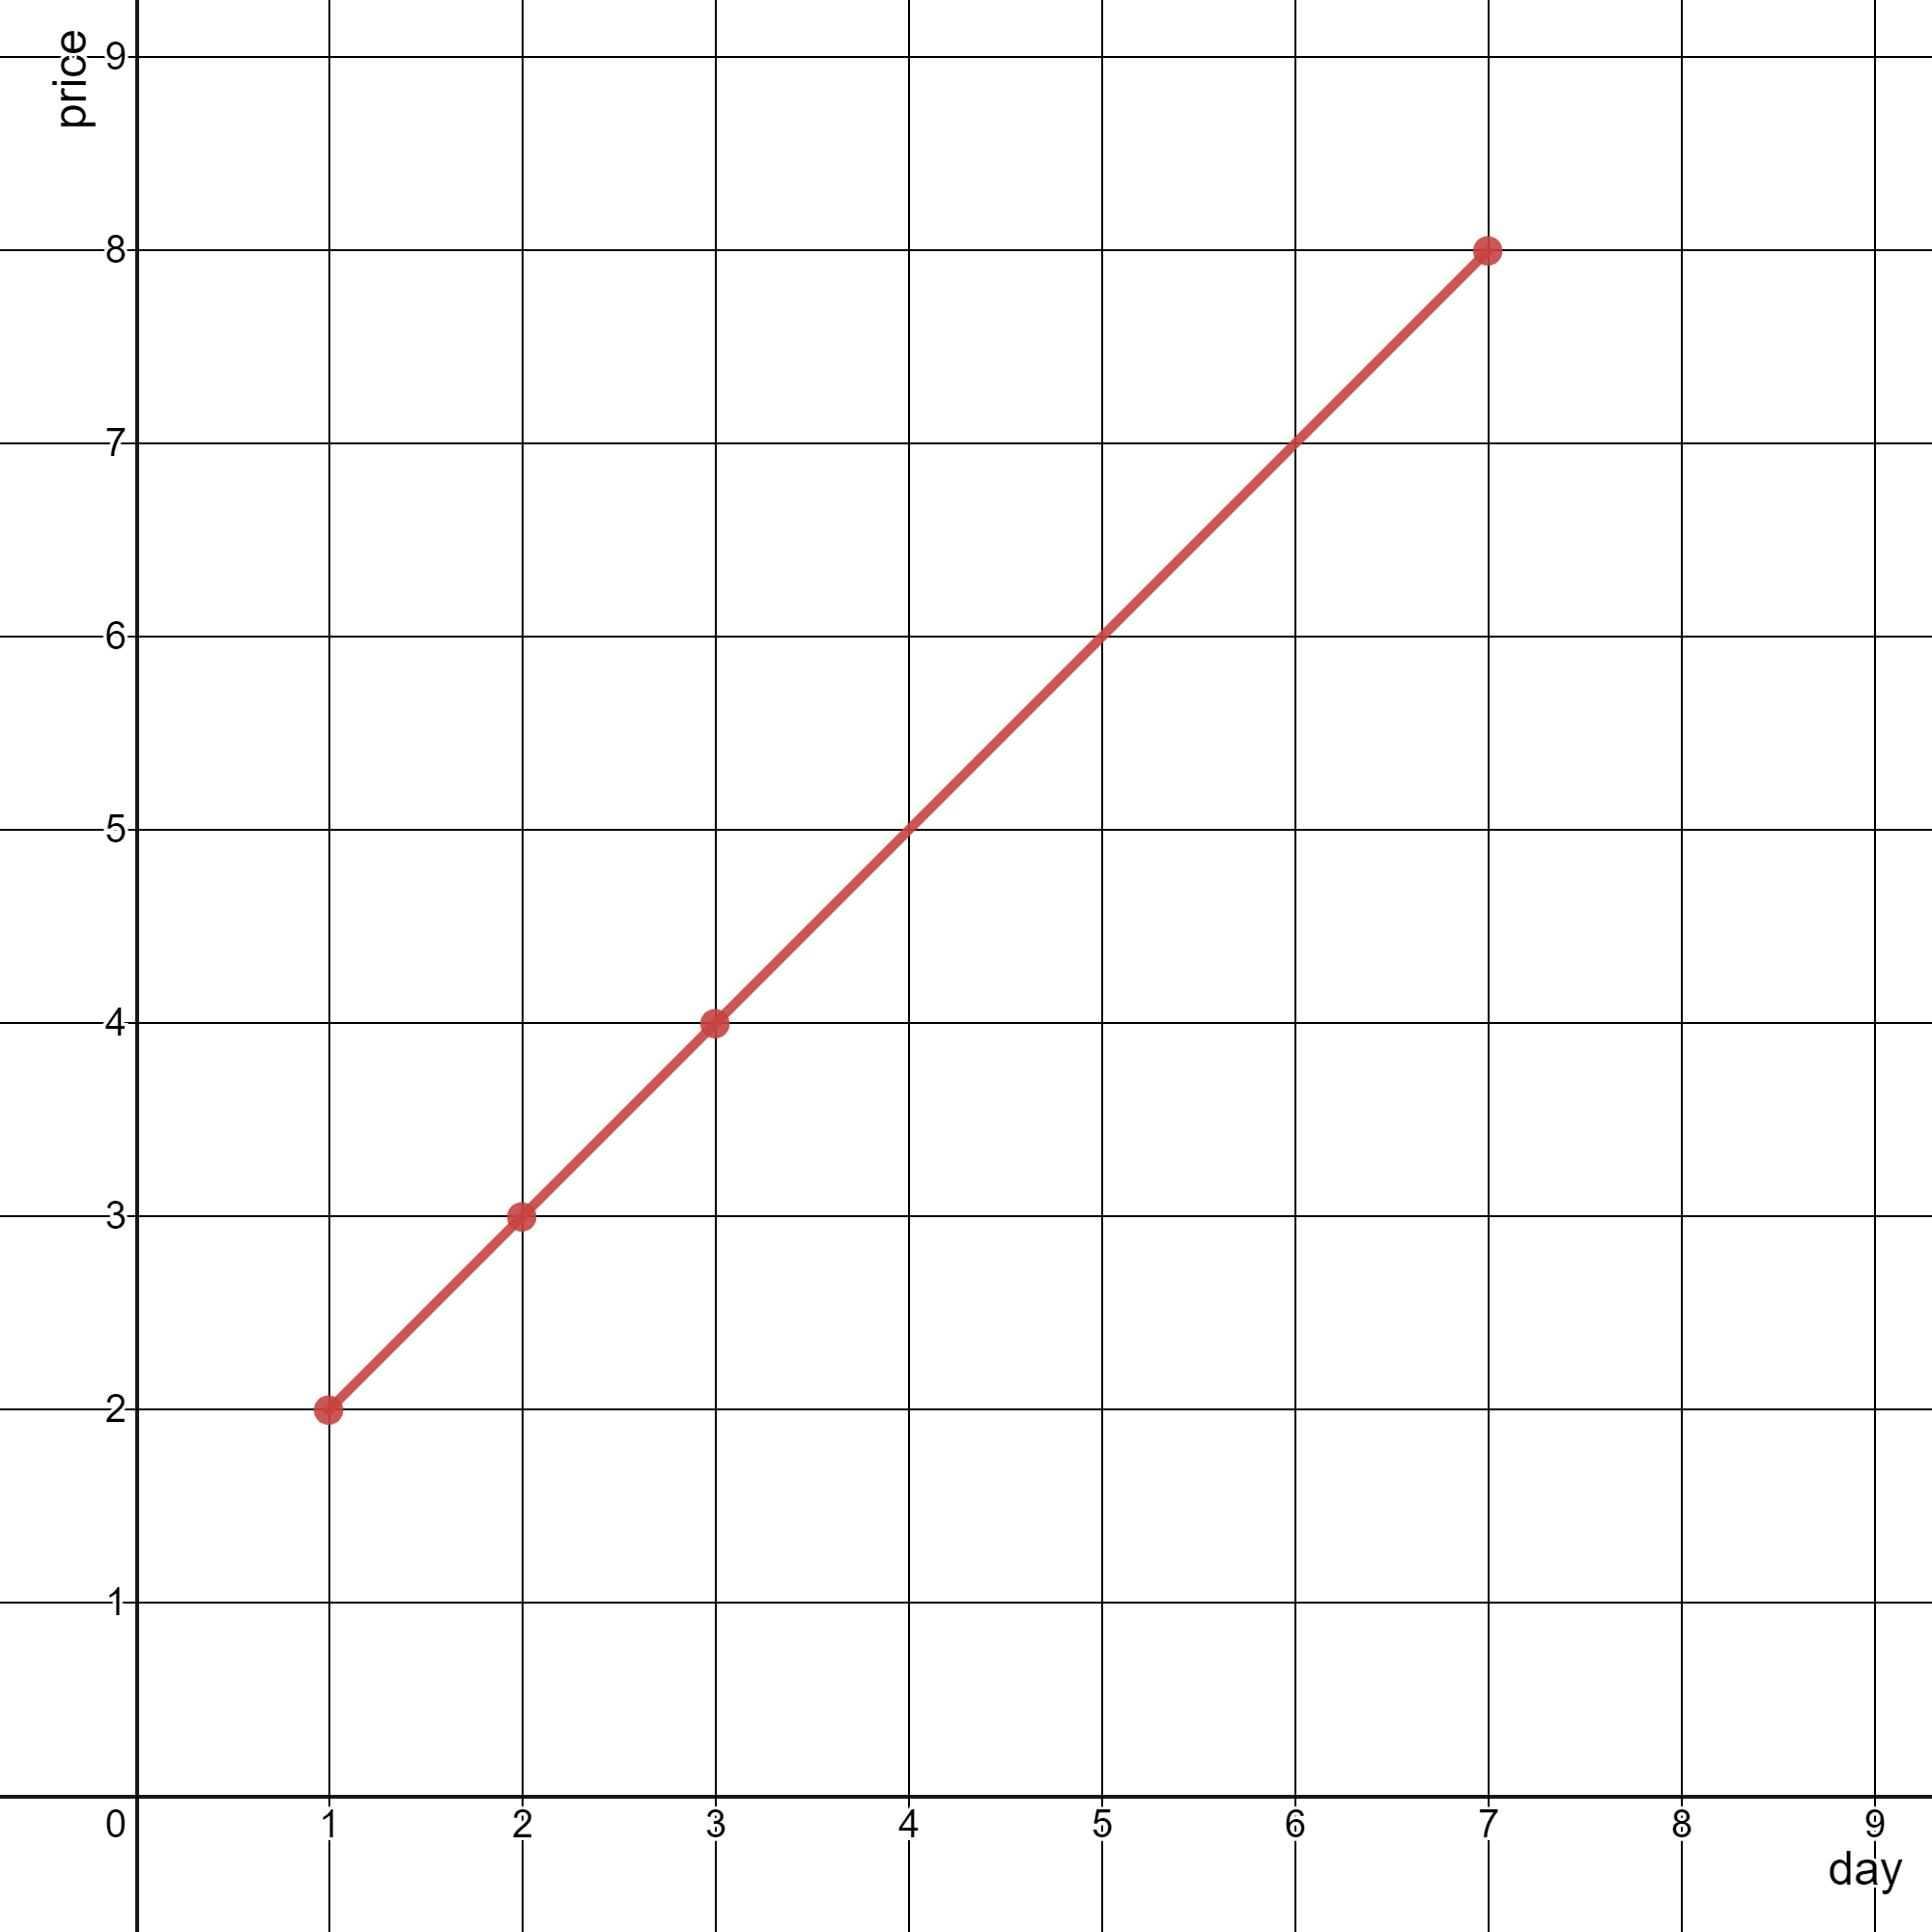
**输入:** stockPrices = [[3,4],[1,2],[7,8],[2,3]]
**输出:** 1
**解释:**
如上图所示,折线图可以用一条线段表示。
提示:
1 <= stockPrices.length <= 105stockPrices[i].length == 21 <= dayi, pricei <= 109- 所有
dayi互不相同 。
方法一:排序 + 遍历统计
思路与算法
首先,我们将折线图的点按照横坐标升序排序。排序后数组 stockPrices 中的相邻格点连成的线段即组成了折线图。
我们用 n 来表示折线图的点数,并用 res 统计表示折线图所需的最少线段数。当 n \le 2 时,折线图的表示方式唯一,即需要 n - 1 条线段表示。当 n > 2 时,我们可以从左至右遍历每一对相邻的点对,并判断该点对组成的折线是否可以与前面相邻的折线(如有)合并,进而计算最少的线段数。
具体地,我们令 res 的初始值为 1(代表 stockPrices}[0] 与 stockPrices}[1] 构成的线段),随后,我们从 i = 2 开始遍历相邻点对,并判断 stockPrices}[i] 与 stockPrices}[i - 1] 构成的线段是否可以与前一组相邻点对 stockPrices}[i - 1] 与 stockPrices}[i - 2] 构成的线段合并,即两条线段的斜率是否相等。
我们用 dx}_0, \textit{dy}_0 表示前一组相邻点对的横纵坐标差,用 dx}_1, \textit{dy}_1 表示当前相邻点对的横纵坐标差。则两组线段的斜率分别为 dy}_0/\textit{dx}_0 与 dy}_1/\textit{dx}_1。此时如果两组线段斜率不相等,则代表两条线段不可以合并,我们将 res 加上 1;反之则代表可以合并,我们无需进行任何操作。
当遍历完成所有相邻点对后,res 即为最少的线段数,我们返回该数值作为答案。
细节
在比较斜率 dy}_0/\textit{dx}_0 与 dy}_1/\textit{dx}_1 时,为了避免浮点数的精度造成误差,我们可以对两边进行通分,即判断 dx}_0 \times \textit{dy}_1 与 dx}_1 \times \textit{dy}_0 是否相等。
同时,在通分计算斜率是否相等时,中间值 dx}_0 \times \textit{dy}_1 与 dx}_1 \times \textit{dy}_0 有可能超过 32 位有符号整数的上界,因此我们可以考虑用 64 位整数保存中间值并进行判断。
代码
1 | class Solution { |
1 | class Solution: |
复杂度分析
时间复杂度:O(n \log n),其中 n 为 stockPrices 的长度。即为对数组进行排序的时间复杂度。
空间复杂度:O(\log n),即为排序的栈空间开销。